In the recent post Usefully Consuming Time I wrote about classifying galaxies in the Galaxy Zoo Hubble project. This is one project found at Zooniverse, where anyone with the desire and a bit of time on their hands can participate in any of eight astronomical projects.
The latest of these to be started is Planet Hunters. The Kepler satellite has been gathering data on about 100,000 stars for a couple of years now, a brightness measurement for each of them each thirty minutes. While software is being used to scan the light curves of each star for evidence of transits by planets, the Planet Hunters projects is pitting people against computer software, considering that people are better at matching patterns. I had to give it a try, so I logged in and learned to classify starlight curves.
 The usual pattern is a fuzz of dots running across the screen, representing the twice-hourly brightness measured over a thirty-day period. If it looks like white noise, it signals "Nothing of interest here, folks. Let's move along." Many of them are wavy fuzzes, signaling a variable star. The tutorial explains the basic kinds of starlight patterns.
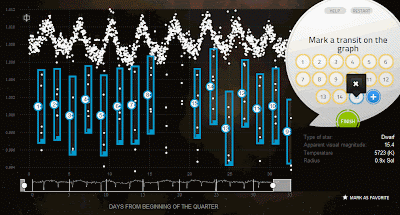
One of the patterns I was presented is this one, in which seventeen transit events are visible in the starlight curve of a variable star. At the time I took this screen shot, I had marked fifteen of the seventeen. This image shows several things. Firstly, ignoring the transits, the wavy fuzz at the top shows that the star brightens and dims by a small amount about every four days. Secondly, the fuzziness of the wavy line represents the small variation in instrument response that is characteristic of any repeated measurement. There is a scale up the left side of the chart that shows this variation is a small fraction of a percent. Thirdly, there are the transit signals, the dips that occur about every two days, which I am marking with blue rectangles.
These are very deep, very obvious dips in the brightness of the star. They indicate something in a close orbit about this star that obscures about one percent of its light every two days, taking about three hours to cross the face of the star. This star is indicated, in the table at lower right, to be a dwarf star with a diameter 0.9x that of our Sun. That is about 1.25 million km, so the object is moving at 420,000 km/hr. That is about four times as fast as Earth moves about the Sun. The two-day period yields a circumference of its orbit as 20 million km, or a radius of 3.2 million km. These figures assume the transit is close to central. The 1% obscuration indicates the object is 1/10 the diameter of the star, or 125,000 km, which makes it comparable to Jupiter (143,000 km).
By comparison, an alien Kepler mission that happened to observe Earth would see the following: Obscuration by 0.01% that lasted thirteen hours, once each 365 days. Such a signal is quite subtle in the fuzz of a starlight pattern like that shown above. But it ought to be visible. It would only be seen, however, in one thirty-day run out of twelve. Also, only one star in more than 600 is placed so as to observe any transit of Sol by Earth in the first place. So, there will be a number of "easy hits" like the one above for every one that might indicate a planet similar to Earth. But the discovery will be worth the search.
This is quite a bit different from classifying galaxies. I've decided, when I am one one computer that I use, I'll classify galaxies, and when on the other, I'll hunt planets. Any taker out there for some of the six other Zooniverse projects?


No comments:
Post a Comment