Showing posts with label citizen science. Show all posts

Sunday, June 22, 2025

Another naturalist, more yards

 kw: book reviews, nonfiction, science, biology, naturalists, natural history, citizen science, cities

When you think of Picnic Guests, what do you imagine? This image probably doesn't come to mind. Ants are the more likely thought. The third chapter of Secret Life of the City: How Nature Thrives in the Urban Wild, by Hanna Bjørgaas (or the fourth if you count a long "Introduction") considers ants. Ants that invade the author's city apartment, ants that drive her to consider chemical warfare. Discussions with a couple of scientists dissuade her, and she simply pays more attention to keeping things clean and outwaits them.

In the meantime, she uses a magnifier to get a closer look at one. At 20X, it looks quite fearsome. Ants are well fitted for living in a great many environments. They may be the primary ubiquitous animals. They live on six of the seven continents; none are native to Antarctica (the only insects that live there, in a few coastal areas, are a couple of species of midges that can survive being frozen for half the year). They abound everywhere else, and probably outweigh the sum of all mammals, humans included.

Ms Bjørgaas lives in Oslo, Norway. Her book was translated from Norwegian by Matt Bagguley. The nine titled chapters touch on living things she paid attention to during nine months of the year. She begins the year with crows, the most intelligent birds most of us are likely to encounter. Crows in the city, like many types of city birds, are less skittish around humans than their more rural cousins. They may not be as human-adapted as pigeons—sometimes you almost have to step on a pigeon before it flutters away—but they seem to have a keen sense of how far you can reach, should you be so inclined.

In the Introduction, though, which takes place in Antarctica where she worked briefly as a tour guide, her focus is not so much on penguins as on a particular species of lichen that caught her eye. Both crows and lichens appear later in the book also. The November chapter focuses on lichens, and is titled, "The Written Language of the City." This is because, among the great variety of lichen species, some are more sensitive, and others more tolerant of the polluted air of cities, particular when it includes sulfurous (stinky) gases. 

This picture shows at least three species of lichen on an old branch, in an area with rather clean air. Using citizen scientists to help collect observations, researchers have developed a "lichen scale" to measure the level of air pollution in and around cities. One may then map concentric rings that surround sources of more egregious stenches such as paper plants (Sixty years ago I remember the smell of paper plants near Newark NJ, which my cousin called "the armpit of New Jersey". It's been cleaned up a bit since then).

The author did an experiment in soil fertility. She bought nine pieces of cotton underwear and selected three locations, one in a desiccated city lot, one in a park, and one well outside the city in the forest. In each, she dug three holes and buried a garment a spade-length deep in each hole. Months later, there was nearly nothing left of her "offerings" in the forest, and the parkland holes yielded semi-composted cloth bits. The third location had been paved over since, which demolished that part of the experiment. I expect that the cloth may have been darkened a bit, but would have been otherwise almost unchanged, and I suspect she would agree. That's what others have found.

If you find the spectacle of a woman digging holes in a city park amusing, consider coming across her prone upon the ground, examining the contents of a shallow scrape with a strong magnifier. She did a little of this, as she tells in "August: Stories from Underground". With a bit more discretion, she visited a soil scientist, who showed her the life beneath our feet with a video microscope. A tiny springtail (the size of a comma) was a hideous monster compared to protozoa and other small denizens of the soil. And, of course, it must be said that the number of bacteria in a teaspoonful of soil will typically exceed the entire human population of the earth, perhaps ten times over. Even the dry, sandy soil of a trampled path in a city may contain a billion bacteria per gram.

This book is a delightful contrast to nature books that tend to concentrate on, for example, birds, or beetles, or some other focus. There is room in the concept of "naturalist" for anything living. I wish the book had an index. Still, it is fascinating and it opens one up to some of the variety to be found in any environment, if we will simply slow down and look, and listen, and observe.

Monday, June 16, 2025

The naturalist in the yard

 kw: book reviews, nonfiction, science, biology, naturalists, natural history, citizen science

I took this picture in 2010, the first year I participated in the Great Sunflower Project. It is a sweat bee of a species common in the mid-Atlantic area, gathering pollen from a Lemon Queen Sunflower, the flower designated in the Project for attracting pollinators, primarily native bees. For those who like to be involved with natural history in their own surroundings, GSP is one program that Thor Hanson recommends in Close to Home: The Wonders of Nature Just Outside Your Door.

According to directions, I planted sunflower seeds in early spring, and once the flowers began to bloom, I stood nearby for 15-30 minutes a few times weekly to record what I saw. The project organizers don't expect us backyard naturalists to identify the species of every bee. They supply a simple field guide to several broad types of common bees, and participants report how many of each type appears during each session of watching.

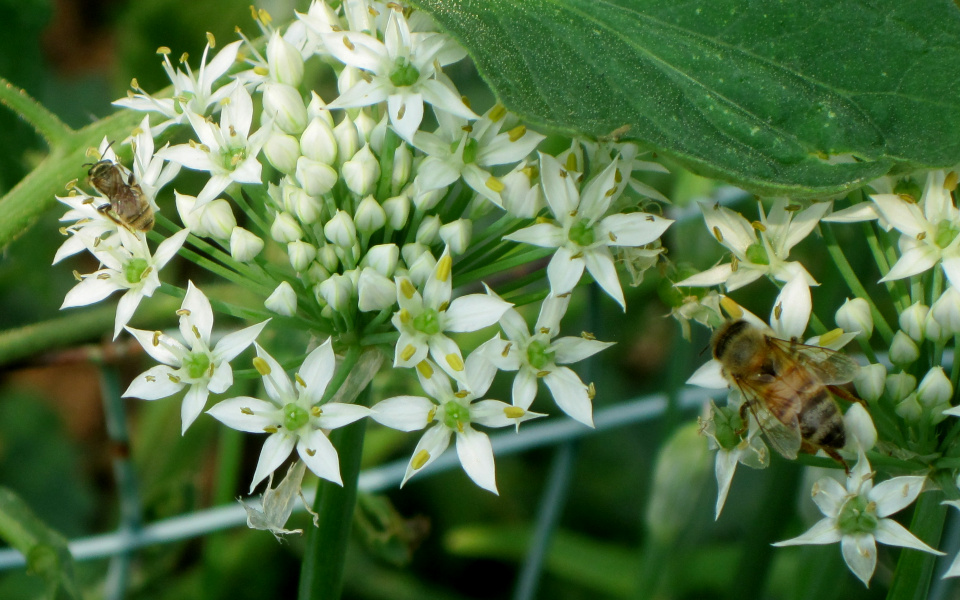
That year I saw very few honeybees, at least in the late summer when the sunflowers were blooming. But as summer cooled toward autumn, I saw a few more, not just on the sunflowers, including this one on a flower of garlic chive, near a smaller bee that I don't recognize (it is near upper left).

I participated in the project for several years, then stopped. Standing around on a hot August day is rather hard on me. But we have plenty of fare for pollinators in all seasons, as seen in the pair of pictures below:


On the left, three tiny bees (about 8mm) are picking over Sedum flowers that bloom in the spring next to our front walk. Oh the right is a flower bed with flowers for all seasons. A Hellebore is almost hidden beneath late-spring-blooming evening primroses. The Hellebore blooms from February until June. We have a few in other parts of the yard, to keep pollinators supplied while they await other kinds of flowers. In mid-June the Echinacea begin to bloom, and carry on for a month. Lavender and heather flower later, and several other flowering plants push the season almost to first snow. This garden is next to a crabapple tree, that flowers in mid-spring, and across the yard, an apple tree flowers in early spring.

One more creature we recently began to try to attract is the Monarch butterfly, with these milkweed plants. There is a schoolyard nearby that has a big patch of milkweed, but this is just the third year for us. We started with a single plant we grew from seeds we collected in the schoolyard. So far we haven't seen any butterflies, but these plants attract many more honeybees than I've seen in ten years or more. They also become infested with milkweed bugs. When they are very small, the little red nymphs must have honeydew like aphids do, because ants tend them.

Early in the book, Thor Hanson uses the term "backyard biology." Later he says it might be better to speak of "yard biology," though it is less euphonious, because nature doesn't just hide out behind our houses. It is all around us. The ten chapters (plus an Introduction and Conclusion) reveal the manifold riches of his own yard. Of course, he does live on an island in Washington state, with a yard that's bigger than average…multiple yards, from the sound of it. However, any of us, if we're willing to slow down and observe, can see a lot.

Thinking it over, we can gather quite a list of the variables that lead to quite a variety of creatures making themselves at home in any yard: variations of light and shade; warmth on cooler days and shelter on hotter days; foods that appeal to this or that sort of creature; shelter for the shy ones (such as little songbirds) and open spaces for the bold (rabbits, squirrels, and foxes; even deer when apples are falling).

I tend to favor insects because many of them ignore humans if we move gently and don't breathe on them. They're easier to photograph than birds. One acquaintance of the author uses a lighted sheet at night to attract moths, which he photographs obsessively. He has catalogued hundreds of species in his yard. One can do the same for beetles; many will also come to a lighted sheet. The beauty of a light trap is you don't have to catch and kill to identify most species (sometimes it's necessary, though).

Dr. Hanson speaks much of birds, and advises getting not just "a birdhouse" but a dozen or more, of various sizes, because there are many varieties of bird that prefer to nest in cavities. There just aren't enough abandoned woodpecker holes to go around. During my last few years at my company I was on a team that monitored birdhouses scattered around the property. All were sized for bluebirds, which also made them ideal for swallows (2 species), wrens (3 species) and chickadees. On occasion we would find a birdhouse in a more sheltered location that had been taken over by a pair of starlings, which are rather large; they had pecked the hole a lot bigger. At the end of the season we would take that birdhouse to the company shop to be fitted with a new door, this time with a metal collar in the hole! On another part of the property there were much larger boxes designed for wood ducks. My wife and I have talked it over a little. We may get (or make) a few birdhouses.

Another project recommended in the book is iNaturalist. It is a phone app, with an accompanying website, where I find it helpful when I want to edit an entry. TIP: The GPS on my phone is not as accurate as I'd like, so I go into the website later and edit the location if it is too far off. The minimum "native" accuracy of an iNaturalist geolocation is four meters. That's usually sufficient; for us Yanks, that comes to a radius of 13 feet. On the website, if you remember accurately where you were (it shows you a detailed aerial photo), you can enter a value as small as one meter.

Here I have focused on the "what we can do" suggestions. The book is also chock full of stories about various animals of all sizes found in the author's yard, or discussed by his friends and colleagues. Getting closer to what goes on outdoors is good for us. We need to slow down and, typically, just look and listen. It is good to recognize that we are part of nature.

Tuesday, June 29, 2021

Science is a universal human skill

 kw: book reviews, nonfiction, science, citizen science

On August 21, 2017, a total solar eclipse crossed the middle of the United States. For those who couldn't travel to the path of totality, a partial eclipse could be seen throughout the country. I was to work at the Delaware Museum of Natural History that day, and the amount of the Sun to be hidden was about 80%, so it was a significant event. At the Museum, we announced and advertised a public Eclipse Day, with a number of telescopes and other devices prepared for the public to join in.

Here we see U.S. Senator Chris Coons looking through binoculars fitted with special filters so he could see the Sun directly and safely. He was one of hundreds of people who came to join the event.

We showed people how to make a "pinhole" with their hand, or by making a small hole in a piece of paper or cardboard, so they could see the shape of the sun projected onto the ground as the Moon crossed in front of it.

People most enjoyed the four telescopes that we set up for projecting the solar image onto screens, as seen in this photo. My own "stovepipe" telescope is in the foreground. Only a little of the Sun was covered at this point. Just behind it a volunteer is adjusting another telescope to move the image back to the center of the screen. The other two telescopes are hidden by the crowd. The picture below was taken near maximum eclipse.

This event shows that people in general are fascinated by nature and natural events. Yet about 9 people in 10 would say, "I am bad at science." That is because they don't know what science is. They don't realize that our life is built around science. The way we learn to interact with people, beginning in infancy, is by observing how others react to us, and by trying different things to see what the reaction will be, and learning to do what gets the reactions we want. Growing up, we learn how to walk around without getting hurt (too much), how to throw a ball, and a great many other skills, by this ordinary process: observe, experiment, categorize, and predict.

What people actually mean is, they are bad at some of the things "professional scientists" do, such as making formal (and often costly) experiments, or publishing articles. If we broaden "publishing" to include gossip and giving advice, though, and also consider how diligent we are to learn things that really interest us, we are all scientists. It's time we acknowledge the fact.

You may have heard the term "citizen science." Perhaps you have stumbled across one of its manifestations, such as Galaxy Zoo, SETI@home, or the Great Sunflower Project (I'll explain what they are in a moment). Equally likely, you may know nothing of these things yet. In either case, a new book should prove quite a treat!

The Field Guide to Citizen Science: How You Can Contribute to Scientific Research and Make a Difference, by Darlene Cavalier, Catherine Hoffman, and Caren Cooper, introduces just the tip of the iceberg of the immense field citizen science has become. For several years I have participated in a number of projects through the Zooniverse interface, which currently includes 78 active projects, all performed online. I got started at Zooniverse through the Galaxy Zoo, for which I viewed galaxy images from the Hubble Space Telescope and reported their shape and other characteristics. Over time I participated in 36 projects, from counting penguins to transcribing labels. The Field Guide introduces the much broader scope of projects of all kinds, about 1,600 of them, available through SciStarter, which was founded by Ms Cavalier.

The bulk of the book describes more than 40 projects. Some are carried out online (including some of the Zooniverse projects); some are done in the home or yard (such as Great Sunflower, for which you plant sunflower seeds and, once they grow up and flower, count the types of bees that visit them); for some you venture out in nature; some are done by day, some by night; and for some you need to get equipment such as a trail camera or a kit the project supplies. The authors also have suggestions for introducing citizen science into schools, libraries and other public venues, such as the eclipse event I described above.

I have to put in a plug for museums: are you a collector? Maybe you collect things that would interest a museum. I work with the seashell (mollusk) collection at the Delaware museum, and I have noticed that more than half the museum's holdings of 2 million shells in more than a quarter-million "lots" (groups of shells of one species collected at one place and time) were donated by private collectors, either during their lifetime as active collaborators, or they were willed to the museum. Whatever museums exist near you, do find out what kinds of items they are interested in receiving for their collections. If you collect seashells, for example, even if you just pick up "a few pretties" every time you go to the shore, it is worthwhile to have a conversation with a curator of mollusks, to find out what kind of data to collect along with the shells, so if/when you later donate them, they will be useful to the museum and researchers that use the collections for scientific purposes. Museums don't hold collections "just so they'll have them", but so historical and ecological study can be done. Not only do I occasionally take in shells I have collected, a month ago I found a recently dead opossum. After making sure it was actually dead, not just fooling, I put it in a bag and drove it right to the museum, where the curator put it in a freezer (all new animal specimens are put through a freeze-thaw-refreeze routine to kill parasites and their eggs).

The great variety of projects offered through SciStarter will have something, probably several somethings, for anyone with any sort of interest. I created a SciStarter account to see how it compares with Zooniverse. Prior to today, I have participated in 36 Zooniverse projects (and made nearly 20,000 classifications), I also have the iNaturalist app on my phone (but it's early days, I have only "collected" 55 observations), and I recently got the Cicada Safari app to use whenever Brood X erupts in my neighborhood (none so far).

When I set up a SciStarter account, I found that in my profile I could link its dashboard to the accounts I have with Zooniverse and iNaturalist. In the Field Guide I found a few projects I may try out, including Fe-BARQ ("Fe" for "feline": describe your pet cat's personality) and Foldit (a kind of game to investigate how a protein molucule folds). In the past I've run the SETI@home "screen saver", which actually works one's computer flat-out, analyzing signals from space in hopes of finding intelligent life elsewhere; I may do so again.

In the Project Finder I entered a few key terms: my state; "animals"; and checked off project types "at home", "on a hike", and "exclusively online". The project types are inclusive, not combined. SciStarter suggested 54 projects. That was just a test. I can go back later and select one or more to try.

Science depends on data. When citizens collect or help sort and categorize data, it helps professional scientists. It can also introduce us to new friends we meet through the projects, friends with common interests. It is worthwhile to get this book and keep it on hand.

Sunday, October 05, 2014

To regain a river

kw: book reviews, nonfiction, teaching novels, ecology, watersheds, citizen science

The Brandywine River Watershed encompasses 324 square miles (840 square km) and is home to a quarter million people. I am not one of them; I live just outside the watershed, though I am in the larger composite watershed of the Delaware River. (This image is from the Delaware Watersheds site maintained by the University of Delaware)

On a few occasions my family and I have joined with other families to take a canoe trip down a few miles of the river, from the Brandywine River Museum in Chadds Ford, PA to Thompson's Bridge in northern DE. We were advised to avoid ingesting any of the water, and to "do" this trip only once or twice yearly, because the river is polluted. South of Thompson's Bridge, I have seen signs warning anglers not to eat any fish they catch.

Some tributaries upstream of the lower main stem of the river are in even worse shape. How can this be? Another map, from the Red Streams Blue Program, gives a clue (the main stem quality is not shown). The tributaries with fair or good water quality presently outnumber those in the worst shape. It illustrates the adage, "The solution to pollution is dilution." But that can only go so far.

The lovely book Sweet Water Hunt by Connie Nye is the first novel I have seen with a Dewey Decimal number (577.64). Ms Nye used an adventure/detective narrative to create a text in water quality monitoring that is pitched at middle school students and their teachers and parents. Young Wyatt Nystrom, his cousin and some friends, and their parents, get involved with the colorful "Dr, Flo", a UD professor, to solve a mystery found in an old tennis ball Wyatt's dog finds in the Brandywine River.

The lesson of the book is clear. Every substance that falls to the ground within a watershed eventually flows into the river, unless it is diverted or converted to something else along the way. There is much in the book about the water treatment plants in various cities and towns, particularly Wilmington, DE, where Wyatt's father works. A few times there is mention that the treatment plants expel the treated water downstream of their host cities. I wonder what would result if they were required to expel it upstream? Would they invest in even better cleansing methods? (Some European countries have such laws.)

By the time Brandywine River water reaches Wilmington, it has a history, the history of everything that has happened upstream in the watershed. It sends this "experienced" water into the Christina River, and thence into the Delaware River. This is the story of every watershed, everywhere on Earth. If the people living in a watershed do nothing to treat their wastes, the river becomes an open sewer.

I recall living in Cleveland, OH in 1961, when the Cuyahoga River was capped with 4" (100mm) of oily sludge. A few years later the sludge caught on fire and destroyed a number of bridges. At the time, Cleveland's sewer system simply fed pipes that took the waste 5 miles out into Lake Erie. The west end of the lake was effectively dead, and it wasn't safe to swim if the wind was from the north. A great deal of cleaning up has happened since!

The Red Streams Blue Program aims to continue cleanup and treatment efforts in this one small watershed. The book shows how even young children can assess the water quality in a stream, using a census of macroinvertebrates. These are insect larvae, worms and mollusks big enough to identify without magnification. They vary in sensitivity to pollution, so a simple scoring method yields a numerical result. I had an enjoyable read, and I sorta wished our son was 12 again, so we could go try out the methods.

Tuesday, November 13, 2012

A star or two of interest

kw: citizen science, stars

To date, I have classified about 7,000 stars in the Planet Hunters section of Zooniverse. Today I ran across a couple of interesting ones.

First we have a star whose temperature indicates it is a middling G star (~G5), just a bit cooler than the Sun. I could see two apparent transits, which I have marked here. After this screen, I had the chance to examine all the data from this star. There are no other transits apparent, and the star is usually flat-steady quiet. This particular period the instrument seems to have imposed a bit of gentle waviness to the data. These "transits" are pretty quick. #1 lasts 4 or 5 hours, and #2 about 3 hours. Those are consistent with orbits in the 30-60 day range in a star of this size. Since I saw no other transits in data from other periods, I have to instead suspect something else is going on.

Now this star definitely has a companion, but it is probably a small star, making this an eclipsing variable. The transits marked 1-4 show a dimming of about 10%, and thus indicate an object probably a third of the diameter of the main star. The transits marked 5-8 show that it is dim, but not nearly as dim as a planet would be. It is probably an M star, in a 4.5 day orbit, and the timing of the two kinds of transits shows that the orbit is quite eccentric. A short-period variable like this would not have been detected as a variable in the days of photographic photometry, because the variations are only about 4% of the main star's brightness. The Kepler spacecraft's instruments are truly marvels!

Saturday, May 12, 2012

Easier amateur science

kw: science, citizen science, collaboration

For many years my favorite monthly reading was the "Amateur Scientist" column in Scientific American magazine. Over the years, I built a small reflecting telescope, which I still use, a crystal radio receiver, and a variety of other small projects. I was often amazed at the skills of the moderator C. L. Stong and the people whose projects he highlighted. In the course of college and graduate school, I found that I am quite poor in the lab and at the work bench. Thus, although I am also a radio ham, I have never built any equipment. I am an "appliance operator," and my degrees are in geology, where I can go out in the field and hit rocks with a hammer, rather than mix chemicals or try to operate a particle accelerator.

In recent years, I have found ways to participate in science that take advantage of what I can do and leaves to others skills I just don't have. It started with SETI@home, which takes advantage of idle time on one's own computer. There wasn't much for me to do but load the software (which is now based on BOINC – more later) and leave my computer running day and night. Then I found Galaxy Zoo, a Zooniverse project, which lets me do hands-on work, classifying galaxy images from cosmological surveys. Presently, I spend some time, on a day or two weekly, on Planet Hunters (also with Zooniverse – more later), which I like even better: trying to detect planets around other stars using Kepler Satellite data.

There is a third kind of project that is even more hands-on: The Great Sunflower Project. I got sunflower seeds of the right variety at the local Target store, planted a few in a corner of my garden, and recorded the wild bees that visited the plant during a weekly 15-minute session of watching. They are in early stages of the work, having been in existence just a few years. As honeybees continue to decline, we need to know much more about native bees, because one third of crops in the US are pollinated by bees, mostly honeybees.

If you want to help with real science, which way would you prefer? Great Sunflower is an example of fully participatory science. It is the most hands-on, but you don't have to handle any risky chemicals! The other two are more desk-based.


Distributed computing efforts such as SETI@home currently number nearly 100. See the Wikipedia list of distributed computing projects. Some that I find interesting are 
  • rosetta@home, which studies the way proteins fold. I have run this one, and it is fascinating to watch the graphic as every possible combination is tried.
  • QMC@home, which studies chemical reactions using quantum physics and Monte Carlo (statistical) techniques.
  • SkyNet, a study of radio telescope data.
The @home-tagged projects and some others use a platform called BOINC developed at Berkeley, and some projects using it are listed at their Projects page. Others use different means to coordinate your computer and their data.

At present, I like best the citizen science projects exemplified by Zooniverse, which is an umbrella organization that oversees ten projects. As I mentioned, I contribute to Galaxy Zoo and Planet Hunters. But you may prefer Moon Zoo (crater classification) or their Archaeology project, or classifying Whale song.

We can't all be science PhD's and lead big investigations. Most of us won't ever be lab technicians. But projects such as these take advantage of valuable skills many people have, even without studying science formally. Computers can do only so much. What people do with ease, computers find very hard or impossible. Computers plus people can do much more, as these projects illustrate.

Thursday, May 05, 2011

Planting time - for the bees

kw: citizen science, honey bees, bees, hobbies

It is time to get those Lemon Queen seeds and start a new batch of sunflowers! I had a fun time last year gathering and reporting bee sightings as part of the Great Sunflower Project. But it'll be late May or early June before I have new sunflowers blooming. (This image is from The Dailygreen, an article on citizen science.)

I am hoping in the future the Great Sunflower people introduce a project that begins earlier in the spring. My apple tree has already bloomed and dropped its blooms, as have the crab apple and flowering pear trees. They engendered quite a bit of bee activity for just a short time. The dogwoods are in bloom, but don't seem to attract bees. By their smell, I suspect they are pollinated by flies. I am sure there is some reliable pollen-producing flower suitable for extending the bee counting activities into mid or late April and through May.

Until then, this year I'll plant the sunflower seeds indoors to give them a head start in my sun porch, and put them out when they get flower buds.

Tuesday, April 26, 2011

How average a star

kw: citizen science, astronomy

It is only after classifying a star that you get to know its designation. This one is APH23088897, a small star, probably spectral type K5, based on the temperature of 4800K. You'll need to click on the image to read the particulars.

I decided to capture this as about the most average star I've seen, though that depends a lot on what you mean by "average". The Sun is often called an average star, though more than 90% of all stars are smaller and dimmer. But those that are larger range up to 100 times as massive and millions of times as luminous, while the smallest true stars of type M8 or M9 (some folks call M9 the beginning of brown dwarfs) are about one-twelfth the mass of the Sun and very faint. The arithmetic mean of such a distribution is meaningless, but the logmean—the average of the logarithms—is useful. My rough calculation would make a K5 star very close to "average".

Another thing that is hard to average out is the steadiness of the luminosity. This star is slightly variable, with a luminosity range of about a fifth of a percent. This is actually similar to the Sun's range of brightness due to varying sunspot numbers over a period of a few days. Many of the stars I see in Planet Hunters are very steady, with variations less than one in ten thousand, though the precision of recording the brightness is not at that level due to statistical photon noise. The various ways a star can be variable make an average variability quite moot. It is like the rainbow: What is the average color?

So far I have classified nearly 3,800 stars. My current rate is rather low; I spend less time on this computer over all than I did a few months ago. According to some scuttlebutt in the blogs, a few people have classified tens of thousands. The thousands of citizen scientists who are doing this have produced more than 2.6 million classifications to date, and the Kepler team has identified 69 potential planets so far among these data; this is in addition to many found by software methods alone. Humans see things computers don't so both methods are yielding unique findings.

Sunday, April 24, 2011

News flash in planetland

kw: citizen science, astronomy, extrasolar planets

OK, here is what planetary transits look like for a very quiet star, a small (~K6) star that does not pulsate or flare as so many of these do. The orbital period is just over ten days, so the planet is close in. It just appeared in my list of "Candidates".

By my calculations, from the amount of light it eclipses, the planet's diameter is 45,000 km, or just over 3.5 times the diameter of Earth. This makes it just a bit smaller than Neptune.

I didn't observe it on the day of discovery, but a few days later. There is one other star for which I am named (along with a dozen others) as having observed it the first day. This is the luck of the draw; the Planet Hunter team's software parcels out light curves randomly to whoever is logged in.

Tuesday, February 15, 2011

A little math helps

kw: citizen science, astronomy, observations

I have been giving a little time to classifying stars' light curves on the Planet Hunters project, and by now I've classified a couple thousand stars. A recent addition to the process is the option to download a star's data, a boon to statistics-minded folk. The download is offered after one has finished classifying the star and marking any features that look like planetary transits. I hope they'll instead offer the download at the beginning.

This image shows how a simple process can extract a signal from the noise in a light curve. The blue crosses are original data for a star. I added to it two simulated transits, for a planet about twice earth's size transiting the star, which was a somewhat oversize star 2.3 times the size of our sun. In the blue crosses alone it is hard to pick out the transit features at 5 and 30. The red dots show the features more clearly.

The red dots simply show the running average of five data points at a time. The original data points were taken at thirty minute intervals. I don't know how much of that interval is used to gather light, but I assume it is most of the period. The amount of scatter shown is typical of data for a star of magnitude 13. I'll discuss why in a moment. But first note that the scatter of the red dots is much less than that of the blue crosses. One danger of averaging is visible: four features that also look like transits at about 13, 15, 19, and 26. Their narrow width, and the absence of a steady time pattern gives them away as spurious: transits this brief ought to occur frequently, every 5-10 days, and very steadily. The longer an orbit, the slower the planet, and the longer a transit will take.

Why is there this scatter in the data? Primarily because of photon counting statistics. The bulk of the blue crosses are found in the range 0.9999-1.0001, a band only 0.02% wide. This indicates that around 100 million photons were collected per observation of this star. The standard deviation of a counted sample is very close to the square root of the number of counts: the square root of 100,000,000 is 10,000; divide the two to get 0.0001. Many of the stars in the project are magnitude 15, or 6.3 times dimmer than this star. The square root of 16,000,000 is 4,000; divide to get 0.00025. Starting with more than twice the noise makes it more than twice as hard to "see" a transit feature of a specific size.

The averaging simulates counting 5x as many photons, and thus reduces the noise by a factor of 2.2. Even a very close-in planet will have a transit lasting at least a couple of hours, or four 30-minute data intervals, so the averaging helps over most of the range of possible planetary orbits.

So far, I've identified lots of things I thought were transits. One of these has recently been declared a verified transit. I saw that about ten other planet hunters also identified it. Just a tiny thrill, but something to keep a lot of folks checking star after star. Our work helps focus the energies of the people running the project.

Saturday, January 29, 2011

Maybe a planet

kw: science, citizen science, astronomy

In the past few weeks, I've learned to classify stars released by the Kepler Mission to the Planet Hunters project in Zooniverse. Two sayings of Thomas Edison come to mind as I check the light curve of star after star for the telltale feature that signals "planet here": "Invention is one percent inspiration and ninety-nine percent perspiration" and "I learned hundreds of things that don't make a light bulb." To date I've checked about 2,200 stars.

The Kepler instrument records the brightness of about 150,000 stars every thirty minutes. At the Planet Hunters web site, a thirty-day supply of such data are kept and parceled out, star by star, to interested hunters such as myself. The vast majority of the stars have a "curve", really a collection of dots representing the brightness measurements, that looks like this one, except for the little dip at the right end.


This is a typical quiet star, though there is a flare at day 4. The scatter in the data arise from the statistics of photon counting when you are taking short measurements from a 14th magnitude object. As you can see, nearly all the data are confined to the range 1.0075-1.0085. The band of light that draws the eye is mostly in 1.0078-1.0082. This star is a K type star of the same radius as our Sun, so it is probably K0 or K1. A planet the size of Earth would intercept only 0.0001 of its light (0.01%). Now look at the dip near day 30 (on the X axis). Its depth is about 0.00025, so if this is truly the transit of a planet, its size is 1.6 times that of earth. It is even more exciting that the transit takes so long. See the next image:


By counting the dots, I find 34, which means the transit took 17 hours. A transit of the Earth across the Sun, as observed from a nearby star, would take 13 hours, so the velocity is about 75% of Earth's about the Sun. This is a lighter star, so the orbital radius will be similar, but this is also a dimmer star, so I'd say it is near the outer edge of the star's habitable zone, perhaps in a 500-day orbit, comparable to a spot halfway from Earth to Mars in our solar system.

That is a lot to infer from 34 dots on a graph. It may be that there is no planet and this was something else. But it is exciting to realize that some of the features like this one, as seen by "citizen scientists" and cross checked by the project scientists, will indeed signal planets about some of the stars. They eventually expect to find hundreds.

I did a few rough calculations about this project. The chances of finding any random planet about a star of type F, G, or K, in an orbit ten days or longer (shorter ones don't interest me much) is one in thirty. If every star has planets, then the project as a whole could find five thousand. However, the chances of seeing a planet in the habitable zone are quite a bit smaller. For a G star, the chance is about one in 600. Double that (1/300) for a planet of a K star, about half of that (1/1,200) for a planet of an F star. K stars dominate, so overall, the number of planets at a habitable distance from their star, that we can detect with this project, is likely to be about 400 or 500. This number will be smaller if any substantial number of stars are totally planet-free. I count that unlikely.