Showing posts with label forecasting. Show all posts

Friday, June 04, 2021

Linear thinking in a non-linear world

 kw: book reviews, nonfiction, prediction, forecasting, disciplines

My colleague at work had a poster: "Life is uncertain. Eat dessert first." We hate uncertainty, which is why we want to find out what is going to happen. We hate lack of control, which is why we try to control the future. Unfortunately, the future is unknowable and beyond our control. We aren't even very good at self-control. How could we hope to control a world composed of billions of others who are just as uncontrollable as ourselves?

What do you see here? Suppose this represents the general state of someone's health, projected over a long lifetime. Where is its end? If this shows the life of someone who is "fated" to live 85 years, they had a near-death experience around age 35.

Sliding toward the bottom of that valley—was it an illness, an accident?—, it may seem like the end is near and that good health is irretrievable. But, hey, things get a little better almost immediately, and later, a lot better. But that's not where these data came from.

Suppose instead it represents some factor of the economy. Is this part of a bigger picture? What comes after, and what came before? Did you notice that the end of the diagram is close to the level of the beginning, though a little bit lower? There are a couple of big, sustained "UPs", and a couple of big, sustained "DOWNs". In the middle of one of those sustained runs, whether up or down if you had to bet on the future of the rest of the diagram, how would you bet? Would you have any idea what the value would be at any point on this chart?

As a matter of fact, this is a financial chart, and adding the axes shows more context:

This is the Google Finance chart of the weekly closing price for Apple, Inc (AAPL), from 1/1/2021 to date (6/3/2021). It looks pretty dramatic! But check the left axis: the low for the year, in early March, was 116, the high in late January was 143, and the June 3 closing was 123.5 (pretty close to the average for the period of 128.6). If you knew just those figures, you could make a "bet with sideboards" that, for the short term, the stock price would be within ±11%. A final chart will show a little more context:

I downloaded the YTD historical data and charted it in Excel. When a stock price chart includes a zero, it looks less dramatic. From this perspective, this stock has been "flat" for five months.

How long will it stay "flat"? I couldn't hazard a guess. Do this: pick a time frame, such as a year, or five years, or (being more canny) the Midterm Election in late 2022 or the Presidential Election in 2024, and call that "the end of AAPL flatness." Write it down (or put a memo in your phone's calendar). Check it on that date and see if AAPL is still flat, or if it entered a period of serious gyration.

Now think about possible "black swans", such as someone buying Apple, or a competing product blowing the iPhone out of the market, or more globally, a new war, a recession, or a suddenly booming economy and the Dow Jones goes to 100,000. I don't have any idea how possible any of these things are, but if the possibility of any of them is more than a few percent, it would call any prediction about this stock or any other into serious question.

Consider this. The moment-by-moment price of a stock is influenced partly by the market as a whole, made up of investors that represent only a couple % of the population, and partly by the emotions of investors in that particular stock, which number a few dozen to a few hundred people. Wouldn't you expect that predicting the outcome of larger questions might be even harder? A year or five years from now, what will be the health of the economy of the nation or of many nations; what is the likelihood of war between two rival nations; or what of the effects of offshoring or onshoring a major segment of the work force? All of these depend on the decisions of thousands to millions of people!

About two months ago I reviewed a book about forecasting and "superforecasters", the kind of people who are better at making predictions that are at least a little more accurate than guesses. The author of that book referred to another, Future Babble: Why Expert Predictions are Next to Worthless, and You Can Do Better, by Dan Gardner. I spent the past two weeks reading this book, with some care. I think it best to begin with a few statements that caught my eye:

On Behavioral Economics, "In the 1950s, Solomon Asch, Richard Crutchfield, and other psychologists conducted … experiments that revealed an unmistakable tendency to abandon our own judgments in the face of a group consensus—even when the consensus is blatantly wrong. …three-quarters of test subjects did this at least once." (p. 99 in Chapter 4)

On "predicting 'more of the same' ", "…[such] predictions are more likely to be right when current trends continue and least likely to be right when there is a drastic change. That's most unfortunate, because when the road is straight, anyone can see where it is going. It's the curves and corners that cause crashes. …predictions are most likely to be right when they are least needed and least likely to be right when they are essential." (p. 105 in Chapter 4)

On Chaos, or the unexpected influence of small differences, "Like most of what's interesting in life, weather is subject to chaos and all sorts of nonlinear weirdness that limits how far we can peer into the future. Those limits will never be eliminated." (p. 105 in Chapter 8)

The first item above refers to "groupthink", which led to the disastrous Bay of Pigs "invasion" of Cuba early in the Kennedy administration, and to the under-planning of a tragic rescue attempt in Iran during the Carter administration. Do note the successful rescue operation in 1979, of two EDS employees being held in Iran, an operation ordered and sponsored by H. Ross Perot: his decision, carried out under the command of one experienced "hired gun". No groupthink.

Allied to this is the need for certainty, which means the most confident (and loud) voice typically carries the day. But turn the last phrase of the around: one-fourth of the experimental subjects did not succumb to groupthink. Their voice may not have prevailed to "turn" the others (who were all confederates of the experimenters), but they did not give up their view. In the terminology used by Gardner, they were probably "foxes", as in the proverb, "The fox knows many things, but the hedgehog knows one important thing." As one might expect, the hedgehog's "important thing" may or may not be correct, but when it is wrong, the hedgehog will not change his mind. Foxes are more flexible. They are willing to consider whether their thinking is wrong. Using the same analogy, the "superforecasters" I wrote about in April are foxes.

Let us consider the idée fixe, or fixed idea: an idea or desire that occupies one's mind, often to the point of obsession. This is the hedgehog's specialty. It takes work to break free from an obsession, but successful forecasters are willing to do the work, and the extra work to gather knowledge from numerous sources (the fox's "many things"). However, foxes have a hard time getting through to the public, which prefers the certainty of hedgehogs, no matter what their track record (which is uniformly abysmal except for the occasional lucky guess).

I recall that the root word for "fool" in the book of Proverbs is "self confident". It is used about 70 times. Not only are hedgehogs such fools, so are all those who listen to them uncritically.

For the second quote, I'd call it self-evident, but we all have "hindsight bias", which is its basis. There is a road I sometimes take to work. It goes over a rather steep hill. Just at the top, the road jogs just a little to the right, which means if you aren't paying close attention, you will suddenly be halfway into the other lane. A great place for head-on collisions. It would be better if the roadway on either side of the hill were curvy, forcing drivers to pay better attention. Even better if the highway department tore out fifty feet on either side of the crest and smoothed that transition.

Life doesn't usually provide smooth transitions. Look again at the stock charts above. Any two points more than a tenth of an inch apart would seem to have nearly no relationship to each other. In a few cases, a tenth of an inch is enough for a rather dramatic swing. The basic rule of thumb we need to guide us is, "The more confident an expert sounds, the less we should trust the prediction." Let me repeat that:

The more confident an expert sounds,
the less we should trust the prediction.

As fun as it would be to belabor the third quote, about Chaos, I'll forbear. I realize that only the "choir" would take such a word, and everyone else would ignore it. Instead let's realize that Chaos is a manifestation of Nonlinearity. We have linear minds. From many years as a working mathematician, I know how hard it is to think nonlinearly. It isn't natural to us. Even when we know something is cyclical, like the march of the seasons each year, the day-to-day variations of sunlight, clouds, rain and high or low temperature are tough to predict. The best weather forecasting computers do OK for a day or two. After that all bets are off.

Mark Twain wrote about a period of around 100 years in which the Mississippi River's length was reduced by dozens of miles, because a few long, loopy bends in the riverbed were cut off when the river flooded and cut shortcuts. He said that if the trend continued, in another couple of centuries St. Louis would be practically a coastal town on the Gulf of Mexico, and that millions of years ago the river must have been sticking out over the Gulf "like a fishing rod." 

We know that is illogical, and we laugh at it. But we neglect to consider that seemingly regular trends don't persist. Any measure we might look at is more like the stock chart above, with ups and downs that nobody could predict. Over the entire five months charted, the stock price went from 129.4 to 123.5. That's about a 5.5% reduction. But there were a couple of spots in there where a day trader could have gained 10% or more in a week's time, and a couple of others where a day trader would have had to ride out a 10% loss.

I apologize if I keep returning to the stock market as an example. It is an area I'm familiar with. It is seldom referred to in Future Babble. The author's interest is in the way we react to predictions and the way we almost always forget that they very rarely pan out. Most pundits are so wrong so frequently, it is amazing that anybody buys their books. So I'll end with a prediction: 

The pundits and "experts" who are the best at sounding confident will get rich on the gullibility of a public that craves certainty where there is none to be had.

Wednesday, April 07, 2021

Seeing farther, maybe

 kw: book reviews, nonfiction, forecasting, disciplines

Forecasting means different things in different realms. "Prediction is hard", said Yogi Berra, "especially about the future." If you're on a high hillside, looking down at a bend in a river, and a canoeist is paddling industriously downstream, you can see pretty well what he has in store, at least for the next few hundred yards. If there's a waterfall around the bend, it isn't hard to predict that he'll be in trouble if he doesn't soon pull to shore. But there's another factor: You don't know his plan. He may know the waterfall is there, and he is either planning to go ashore and portage around it, or he may have a plan for going over, either because he's really good at riding the rapids, or because he is suicidal. He may not know it is there, and is just exploring, in which case you can hope he has good hearing. Perhaps you can think of other possibilities.

Suppose instead you were asked, "How likely is it that Iran will produce a nuclear weapon in the coming 12 months?" Assuming you can find people without a political investment in that question, and you ask ten of them this question, will you get similar answers, or will they range from, "No way, nohow!" to "I am certain they will."? You may get at least one person who says, "Maybe." I think you are most likely to hear, "How should I know?"…but there I am, making a sort of forecast myself!

Then there is the weather, and there is the climate. When a weather forecaster says, "70% chance of rain tomorrow," what does it mean? Is she talking about your city, your neighborhood, or the whole state (easier to contemplate about Rhode Island than about Texas!)? Let's assume it is a local forecast. Decades ago a weatherman explained on a radio program, "70% chance of rain means that 70% of the area will get rained on." I wonder if that is still true? In these days of supercomputers producing a fresh forecast over the whole earth about every hour, it may mean something else. For example, it may mean that when they run the forecasting software over and over again with tiny adjustments to the initial conditions, 70% of them predict rain in "your area". Or it may mean, of the several hundred supercomputers being used with numerous versions of the modeling software, 70% of them predict rain. Or it may still mean "It will rain over 70% of the several square miles surrounding such-and-such a place."

That last version, akin to the version of half a century ago, is probably still what they mean. The prediction is often based on a squall line passing through. A loose squall line will produce a string of small storms that drop rain for a few miles between formation and dissipation. That might mean 30% to 50% of the area will get rained on. A tighter line will have larger storms, closer together, and we're in the 70% range. A heavy squall line will bring rain almost everywhere, and the forecast is 100% rain.

What about climate? It is the average of "weather" over a period of decades. You can't tell from one year to the next whether changing weather patterns mean the climate is getting warmer or cooler, dryer or wetter. I recently saw an article about cherry blossoms in Kyoto, Japan. They are blooming early this year, during the first week of April (today, the 7th is the expected peak). The article stated that the "usual" peak is between April 10-17. Of course, "global warming" was mentioned. That's funny. Kyoto is south of Tokyo and warmer, and the cherry trees there bloom a few days earlier. We visited the Tokyo area from March 28 to April 11, 1992. The peak of the cherry blossoms was March 31. I presume the peak in Kyoto was closer to March 25. With that in mind, if this year's peak in Kyoto is more than a week later than the peak thirty years ago, neither datum means much about a changing climate.

Back to Iran. There is a reason for stating the question like I did, particularly "in the coming 12 months". The political winds are shifty. If the time frame were 10 years, the answers would, I hope, be different (maybe not!), and much less certain. Too many things can happen in a decade. Lots happens in just one year! But the study and research one would need to do to answer that question are, just barely, possible. Having studied and formed an answer, though, how good is it?

"How good is it?" is the subject of the work of Professor Philip E. Tetlock. He has conducted experiments with numerous forecasters for the past few decades, and has discovered factors that make some people better than others at it. Some are "superforecasters", and with Dan Gardner, he was written Superforecasting: The Art and Science of Prediction.

It so happens that superforecasters have certain characteristics. Super-intelligence is not one of them. Of course, they are intelligent, but the important factors include the humility to question their own assumptions and premises, the willingness to break out of false dichotomies, and the diligence to do lots of study and research. The book has a couple of lists of these factors, which in themselves constitute a good introduction to learning to make better predictions…if you're willing to do the work.

We have to forecast to be able to plan. I have two friends I should mention here. One expects the country to descend into anarchy, and soon. It's not just about President Biden, because he expected the same thing when Donald Trump was President. This conviction colors his thinking. His long-range plans include getting rich enough quickly enough to afford land in some out-of-the way place.

The other friend is older and has a longer view. Remembering the decades of the Vietnam War, and the times that preceded it, and those that came after, he is more optimistic. He also likes suburban living. His long-range plans are very different, including his expectation of a long retirement filled with volunteering and service. If you were to place these two men in almost any situation you choose, unless you know their backgrounds and attitudes rather well, it would make no use to make forecasts about the situation itself. Their own internal landscape would be more important than the external. I dare say, if you were told just one thing about these two men, that one is a paranoid prepper, the other a contented suburbanite, it could greatly improve the accuracy of your forecast. Maybe.

That is a big maybe. Dr. Tetlock found that for most people, if someone had already researched a situation and made a prediction, new information was unlikely to have much effect. Superforecasters, by contrast, would frequently incorporate new information and revise a forecast. Some would do so daily or oftener.

It is helpful to remember that forecasting is like other skills, that practice is needed. To learn to forecast, make lots of forecasts. BUT make them in a particular way: the result needs to be quantifiable. Don't say, "There is a significant chance of X happening." To you, "significant" may mean "a 75% or better likelihood", to someone else, 15%, and to others, as little as 5% or even less. If 75% is what you mean, state it that way. Then keep score. One result isn't too useful. It takes three to see the inkling of a trend, and twelve to begin to do decent statistics. The book contains basic instructions on calculating a Brier Score, a measure of a forecaster's accuracy. It is also useful to learn to use Bayesian methods of revising a prediction. Superforecasters that revised their estimates didn't indulge in large adjustments; they were more likely to change a 40% likelihood to 42% or 37%.

It is also helpful to know that these methods are all about the "what" and sometimes the "how" of something. The "why" of something is outside the realm of science or technology. It is frequently more of a theological matter.

Dr. Tetlock is noble enough to introduce a monkey wrench into this whole matter, by discussing his relationship with Nassim Taleb, author of The Black Swan, a book I reviewed in 2007. The idea of a Black Swan is something nobody could have predicted, but it changes everything. Fourteen years ago I was quite taken with the notion. Now I have a more nuanced view. Dr. Taleb contends that because Black Swans can't be predicted, one cannot account for them, and because they matter more than other events, nothing that can be predicted is going to matter enough.

One of the conceptual ills we encounter is either-or thinking. The idea that Black Swans make forecasting useless is either-or thinking. A superforecaster will weigh the possible influence of something unprecedented throwing everything else out the window, without needing to know just what that might be. This is the realm of the "unknown unknowns" of Donald Rumsfeld. This is also why, as stated in The Art of War (I paraphrase), "No battle plan survives contact with the enemy." Yet a good battle plan puts you in a position to re-evaluate and succeed anyway. I find it fascinating that neither Dr. Tetlock nor Dr. Taleb points out that as historical Black Swan examples accumulate, they allow us to re-adjust our knowledge of the expected range of possibilities, to take a better view of the distribution of possible events, and so make better forecasts and more robust plans. We just need to have or to gain the wisdom to discern whether a particular Black Swan is truly unprecedented, or if it is a case of an extreme event that happens more frequently than we'd been led to believe.

For example, the original Black Swans were discovered in Australia in 1697. They were not new to Australians, of course. They were new to Europeans, who knew only white swans. The Western white swan, Cygnus olor, and the Asian black swan, Cygnus atratus, are related species in the genus Cygnus, but have been separated by half a world for tens of thousands of years. There are four other species in the genus Cygnus, including the black-necked swan, C. melancoryphus. Its existence could have clued the Europeans into the possibility that swans somewhere else on Earth could be black, but it did not.

Other examples used to illustrate Black Swans include stock market booms and busts, and extreme flooding events.  Just last year I discussed a series of mega-floods that caused large boulders to move across a flood plain south of Sturgis, SD. The context, however, was discussing a new way to analyze daily (or weekly or even monthly) changes in the price of stocks. Considering the floods, I realize that the extreme flooding events in the Black Hills may not be extreme examples of the usual flood frequency regime. They are just as likely to be symptoms of extreme weather events that just "work differently" from the ones that occur yearly and decade-to-decade. It wasn't just a thousand-year flood that moved 20-ton boulders half a mile or more. It may have been a 5,000-year flood, except that this happened twenty times in 5,000 years. So something different was happening, and I don't really know what it was. However, we now know that floods of that magnitude occurred about every 250 years in the past, so it's best to take that into account if you want to build anything on the outwash plain east of the Black Hills.

How could you become a superforecaster? An appendix in the book describes the basic skills, and another invites any reader to join the Good Judgment Project, at www.goodjudgment.com. Enjoy!

Saturday, March 13, 2021

Facing fears

kw: book reviews, nonfiction, forecasting, social trends

What makes you worry, or at least wonder, "What if THAT happened?" Mike Pearl, with his column in Vice, "How Scared Should I Be?", is the professional worry wart we all need to take a whack at such questions. His book The Day it Finally Happens: Alien Contact, Dinosaur Parks, Immortal Humans—and Other (im)Possible Phenomena tackles nineteen such questions.

In the Acknowledgements Mr. Pearl confesses to suffering multiple panic attacks while writing the book. For someone who is disposed to think things through, then realize just how plausible many of these things are, the occasional panic attack is justified.

There is only one chapter that touches on a concern I also have, "The Day Antibiotics Don't Work Anymore". The author doesn't delve into the troubles antibiotic resistance is causing already (in the US, almost 3 million resistant infections and more than 35,000 deaths in 2019: on a par with auto accidents). Rather, his focus is what happens when every infectious pathogen is fully resistant, when getting a paper cut becomes a life-threatening event. Every chapter begins with a scorecard. For this one:

Likely in this century? Yes
Plausibility Rating: 5/5
Scary? Extremely, but probably not the Apocalypse
Worth Changing Habits? Yes

The follow-up question I have is, "Will alternative biocides such as bacteriophages be developed (re-developed) soon enough?" I say re-developed, because bacteria-eating viruses (bacteriophages) were in use and effective, and research into developing more of them was a growing technology when antibiotics were discovered and effectively torpedoed phage research. It is ramping up again.

On another matter of which I am rather fond, the author's take on our getting a confirmed signal from intelligent ET's posits a radio reception from a star 13,000 light-years away. In the early days of the first science fiction boom in America, some 60-100 years ago (the days of "Doc" Smith and R.A. Heinlein and a great many others), the universe was usually imagined to be full of alien species, some vaguely similar to us, and others more like semi-familiar animals, and others quite fanciful. This was almost taken for granted by Sci-Fi readers, but few others gave it any thought. The pendulum has swung in a more pessimistic direction since then, with a brief pro-"lotsa aliens" swing brought on by Star Trek and Star Wars. Pessimism rules at present. More and more people realize that stars are far away, very far; that getting somewhere in less than years to centuries or more is about as possible as learning to pole vault a mile; and that life like that of Earth might be so rare that no other planet in the Milky Way is likely to have living things bigger than E. coli. This is actually a pretty good time for an alien signal to be intercepted and verified.

Here's one for keeping Digital Natives awake at night: "The Day the Entire Internet Goes Down." Here is the scorecard:

Likely in this century? Yes
Plausibility Rating: 4/5
Scary? About as scary as it gets
Worth Changing Habits? It would be a disaster. How up-to-date is your disaster preparedness kit?

The only thing he finds more scary is the prospect of nuclear annihilation (Plausibility 2/5), to which he devotes 20 pages, the longest chapter. The "Internet" chapter and one about the closing of the last slaughter house (also 2/5) are tied for second, with 18 pages. He dwells at length on the way the Internet works, and what it would really take to bring it all down. One of the next books on my reading list is 2034 (Stay tuned), about WW3 (or 4?), with China, which reveals just how dependent we are on the Internet, even the military (BIG mistake, Generals!): in the novel China selectively "blinds" the U.S. This leads me to consider that an attempt to destroy the Internet is the most likely scenario at present for triggering a nuclear attack or exchange.

Personally, total annihilation is less scary than almost-annihilation. My wife, born just after WW2 ended, can tell you a thing or two about growing up in a country whose capital (and hundreds of square miles around it) was fire-bombed into oblivion. I have read quite a number of post-apocalyptic stories and novels. None of them seems grim enough to be realistic. I guess I'll leave that right there…

I'm not the sort to fret nearly as much as Mr. Pearl. Reading his treatment of things that must represent his greatest fears was enlightening and enjoyable. Really! He is clearly laboring to allay his own fears and in so doing he makes each of them, if not less fearful, a bit more comprehensible.

Monday, June 22, 2020

Polyanna on Steroids

kw: book reviews, nonfiction, futurism, forecasting, internet

Émile Coué taught his patients to repeat as a mantra, "Every day, in every way, I am getting better and better." It is no coincidence that he is a co-discoverer of the placebo method. There is no irony in saying that many of his patients did indeed improve, because reassurance can powerfully influence our feelings and speed our healing, whether emotional or physical. Now, if only we could induce society as a whole to adopt this mantra!

Byron Reese may be the man to do it. He just needs a bigger pulpit. For the time being, his book must do: Infinite Progress: How the Internet and Technology Will End Ignorance, Disease, Poverty, Hunger, and War. The book was published in 2013, shortly after the beginning of the second term of President Obama. The one positive thing to come out of Mr. Obama's work is his book The Audacity of Hope. By comparison with Mr. Reese's book, it seems short-sighted.

Using the past as a springboard into the future, Infinite Progress outlines the large trends that the author expects to continue into the future, and to produce ever-increasing prosperity, from which the other benefits will be derived. Thinking back over his contentions and discussions, I must agree in part. These things can happen. Whether they will or not, human nature will have a big part to play, but so will nature. The current Coronavirus pandemic and the over-reaction of the immune system of the body politic is a Black Swan to beat all black swans.

I was much enamored with the book The Black Swan, and have written about the principle a few times. However, I was seduced, as was N.N. Taleb, the author, by the Cauchy Distribution he cites as a good model for stock market activity (it isn't, but that's another story). I was seduced into thinking that black swans are part of the normal course of things; that they are extreme but otherwise unexceptional. Of course, they are not. The Europeans who were astonished to see black swans in Australia didn't initially realize that the Australian Swan is a different species, Cygnus atratus, than the mute swan, Cygnus olor. I also considered floods and the seeming over-abundance of 1,000-year floods in some areas. However, on closer examination, the extreme floods are produced by a different climatic mechanism than the more ordinary seasonal floods of the five-to-hundred-year variety. They are part of a different population, a different species of storm, if you'll forgive me the use of a biological term.

As dominant as the present pandemic seems to be, the trends Byron Reese outlines may be delayed, but possibly not by very much. I like his analyses, and I hope he is right. But allow me to comment on the five trends, not as a skeptic, but for a cautionary purpose.
  • Ignorance – To summarize a story from a century-old Christian tract: A believer was witnessing to a friend who owned a soap factory. The friend was skeptical. They came across a dirty boy playing in a mud puddle. The believer asked, "Why is this boy dirty? Your soap factory is nearby!" The friend said, "Soap is only helpful if you use it." The believer replied, "So is the Gospel." Then, from a piece of calligraphy on my bedroom wall: "Wisdom is knowing what to do / Knowledge is knowing how to do it / Success is doing it". Near-infinite knowledge on more subjects than any person will ever even know exist (Wikipedia has 6+ million articles in English and many more in 300+ other languages; Google indexes 30 trillion web pages). It isn't hard to find out a lot about anything. But I have a maxim and a corollary that are worth a book of their own: "Those who will learn from others have fewer scars. Most people have too many scars."
  • Disease – Most doctors begin their careers full of optimism and altruism. Far too many succumb to a profit motive and end up using "treatments" that maximize cash flow rather than minimizing suffering. Most drug and medical equipment companies were begun similarly, and followed a similar, cynical path. Perhaps we must adopt an attitude of "I pay only for success, not for 'trying'." By the way, it is stated on page 90 (in the eBook), "Even smallpox has been sequenced and is available for download." One insane person can bring it back; millennials and younger are not vaccinated… But to the point, let's make sure cures are profitable and infinitesimal "improvements" are not.
  • Poverty – Jesus said, "The poor you will always have with you." He knew human nature. People differ dramatically in ability, and some just roll nothing but Snake Eyes. However, as prosperity spreads, as Reagan's Trickle-down Theory works its magic (don't scoff, it led to the biggest postwar boom ever, including the recent one from 2/2017-2/2020), "poverty" will be defined as having a smaller TV, and perhaps only one thereof (rather than not having a house in which to put one); having only one "good suit" (rather than having only rags); and so forth. America's poor are better off than all but the richest Africans. The other question to ask is, can Earth sustain that level of prosperity for all? Is our planet big enough? This is not sufficiently addressed in the book. A big part of the book's plan is offloading all dehumanizing tasks to machines. Are we ennobled by idleness? Because there may not be enough "humanizing" tasks to go around.
  • Hunger – The author seems to have assimilated without question a statement by Colin Clark in 1967, that the minimum space necessary to feed a person was 27 square kilometers. I beg your pardon?? He must have misread Clark. The land surface area of Earth is about 148 million sq km, and the arable (farmable) area is 31 million. At 27 per, that could only feed a little over one million of us. Arable surface per person is presently just over one acre. I looked up Colin Clark's writings. His estimate of maximum population ranged from 28 billion to about twice that (…for American standard of living, and 148 billion at a Japanese standard of living), but he over-measured the arable surface, so as well as I can determine, he considered the land needed per person at about 270 square meters (Japanese standard) or 680 sq m (American standard). As the author tells us, most hunger is structural, meaning people can't afford food or can't travel to where it is affordable, because the Earth still has a food surplus. I'll comment later on population growth. The author believes we'll always find away to increase yields.
  • War – The trends and discussion boil down to this: Make war economically unaffordable, and most warfare will end. More trade, more co-industry and so forth. Of course, there is still fanaticism we must deal with, and the lesson of the 9/11 disaster and the ensuing 19 years is that the existence of "The Great Satan" (i.e., the USA) is sufficient reason for ongoing warfare between Islam and the West. (Note, I consider the term "radical Islam" to be a redundancy). Ideology will always trump prosperity.
Will there come a time of plenty and peace? As a Christian, knowing human nature from decades of counseling unhappy people, and believing the Bible, I see peace only in the kingdom of God. But of course this book has no relation to anything Biblical. The author is a historian, not a theologian. So let's suppose his dream largely comes true. Not as all problems being solved, but the five big ones he identifies being largely mitigated. Will the 24th Century be a Star Trek century of peace and plenty? A lot depends on how rapidly human population approaches the "Japanese standard of living" threshold of 148 billion. For it is sure to do so.

The global rate of population growth is 1.1%/yr. That's lower than it was when I was a child, by about half. Will it go lower? First let's look at what results if it doesn't:
  • near-Today (3/2020): 7.8B
  • Year 2100: 18.7B
  • Year 2200: 56B
  • Year 2300: 167B – This is close to the year the Enterprise would be launched in Star Trek.
Oops! We've already passed 148B. Will farming methods have improved enough that we can feed one-sixth of a trillion people? Probably. But there won't be a chicken in every pot, that's for sure. Not even a vat-grown pseudo-chicken. So here is another maxim of mine:
Just because Malthusian predictions have been shown to be wrong several times, doesn't mean that will happen forever.
OK, Let's cut the rate of population growth in half, or a bit better, to 0.5%/yr. Then:
  • Year 2100: 11.6B – Better…
  • Year 2200: 19.1B
  • Year 2300: 31.5B
  • Year 2400: 52B – About where the table above was in 2200.
And so it goes. Hundreds of years may seem like a long time, but sooner or later the permanent mantra of all living things, "Reproduce or else!" must come to an end or we'll just eat the whole planet. Isaac Asimov once showed that, if 10% of all substances on the surface of the earth could be converted to food, Earth would still be exhausted, at a 0.5% growth rate, in a couple of thousand years, and if we have gone to the stars by then, all possible planets in this galaxy will be comprised or people and people's food from pole to pole, in another 11,000 years.

And all that is not even a black swan. The sixth item that needs to be tackled is the human drive to reproduce, or everything else is temporary. Thus, I must conclude, even though the book's title is Infinite Progress, we must content ourselves with "Really immense progress" followed by some very well-thought-out Plan B when that isn't enough.

Does that mean I deny the author's reasoning? Not at all. I hope he is at least partially right. But there are so many ways to go wrong, and so few ways for things to go right, that it will be an uphill slog. I like the optimism. That alone makes it worth reading and thinking about.

Friday, May 11, 2018

How soon would you like your future to arrive?

kw: book reviews, nonfiction, futuristics, forecasting

OK, so where are the flying cars? Well, junior airmen everywhere, the first commercial one recently went on sale! For a mere $400,000 or so, you can own a brand-new Aeromobile. More upscale models range up to $1.6 million. Oh, you said, an air car for all of us? That could take some time. In the meantime, you just need two licenses, drivers' and pilots', and the financing, and an air car can be yours. I wonder where you'll be permitted to use it, with anything like the same freedom you use an automobile?

I remember a brief fad of building one's own ground-effects machine ("hovercraft"). I wanted to do so, though I was about 15, and I was doing all kinds of design and planning. But I wasn't planning on earning the money required…funny how the teen brain works. I mean, I had a spare lawnmower engine, with maybe 3 hp. A typical design found in, for example, Popular Mechanics, needed 10 hp, and used a chain saw engine. I talked to my dad about it. He had a practical point: "Why use all that energy keeping yourself off the ground, when four wheels will do it without burning any gas at all?" First nail in that coffin. More would follow.

Fast-forward half a century or so. Everything has a cost-benefit analysis associated with it. What is the benefit of a flying car? Usually, not much. If there is no road between the Point A where you are, and the Point B you want to get to, then maybe it can get you there, as long as the place has a pretty good landing strip (the Aeromobile and its kin cannot land straight down). But you can get a helicopter ride to the same place for a lot less than 400 grand, and you don't need your own pilot license. So, besides the cachet of having a really fancy toy, there isn't much benefit to the flying car. Not even if it cost a "mere" $100,000.

I just had a lot of fun reading Soonish: Ten Emerging Technologies That'll Improve and/or Ruin Everything, by Kelly and Zach Weinersmith. Zach is the cartoonist of Saturday Morning Breakfast Cereal; Kelly is a faculty member at Rice University. They discuss ten "emerging technologies" in various states of emergence (and just a few others in an added chapter). Of the ten, the first two have to do with space, "Cheap Access to Space" and "Asteroid Mining". The cheapest way to get things off the Earth, like, a few thousand miles off the earth, is with a "space elevator", if you ignore sunk cost. The price to lift a kilo of stuff to orbit is presently around $10,000. Incremental cost could go as low as a few dollars. However, add the amortized price of the elevator, it would be a lot higher. How high? I haven't seen a credible projection, and neither have the Weinersmiths. Because (1) we don't yet have materials strong enough to build it, and (2) whenever we do have them, the construction cost will be greater than the total budget of all the nations of Earth for a century or so. That is a lot to amortize!

Hmmm. OK, suppose the cost is, in today's US dollars, 100 Trillion. If we gave everyone on Earth a joyride to geostationary orbit and back for, say, $1,000, and the population was 10 billion, that would only pay of the first 10% of it. Charge $10,000, and now you have it. Of course, 90% of the people on Earth can't afford even a $1,000 joy ride that would likely take about a week. And how many people could you run up-and-down the space elevator each week? How long would those 10 billion joy rides take? I'll leave further speculation and calculation to you. Trust me, people are being born faster than you can send them up and down any practically-sized space elevator.

The Weinersmiths take a great combination of lots of information and a stiff dose of humor to deal with their ten subjects. Augmented Reality, for example. A really good system would allow you to live in a single room some 20 feet on a side, that could appear as any room you want to be in, in the eyes of your AR system. That, and some Programmable Matter (a different chapter) to be instant furniture and various implements, and you could live almost any kind of life you like. Though it seems to me a lot like prison, just with better views and a bunch of cool "instant toys". Then there's the "outside" kind of Augmented Reality, where you can know everything about whatever you see using the heads-up displays in your contact lens or whatever: I foresee people at first being totally enamored at knowing everything there is to know about every random tree or building or animal or person they see, for, say, an hour or two. Or maybe ten minutes. Then overload kicks in, and they'd quit making whatever "hey, look this up" gesture or command they've been using and get on with life.

Precision Medicine seems a good thing. I hope it works out. You get your DNA tested and find out which things will cause what side effect, and if you are lucky, treatment Zed will have no noticeable side effects, for you. Maybe. I wonder, though, at the cost of medicine so utterly focused that a new drug has to be developed just for you, for anything that happens to you. How many people will find out they aren't really well-suited to using almost any actual treatment on the market? Of course, you probably knew that already. After all, that's why everything you try has side effects; if you can live with them, fine, you get cured or whatever, but you're scared to go through that again.

What will happen, and what won't? Who's to say? Nobody predicted that the first men to visit the Moon would do so on a color TV broadcast, watched all over the Earth. So at least some of the various ideas explored in Soonish are likely to come to pass. Whether we can afford any of them is another thing. And I had a kind of global realization: nearly none of this applies to the majority of the world outside the Euro-American sphere.

Sunday, October 06, 2013

Looking too hard, and not looking

kw: book reviews, nonfiction, forecasting, prediction, statistics

We are remarkably good at cutting through the clutter in many situations. For example, we can talk to someone at a crowded party and pick out what they are saying in spite of the noise all around; and we can often spot a familiar face in a crowd. However, we sometimes see (or hear, etc.) things that are not there. When I was a child we would look for faces or other shapes in clouds. In a few minutes of looking, something suggestive is bound to appear. And there is a painting by my father of waves breaking on a rocky seashore. One of the big rocks looks like a leopard's head, and once I'd seen it, ever since I always see that leopard's head whenever I glance at the painting.

My father had no intention to hide faces in his paintings. Seeing the leopard's head is an example of a Type 1 error. If my father did actually hide faces in all his paintings, and I have noticed only this one (I have several others), then missing the faces that are there would be Type 2 errors. If I become so rapt in searching clouds for faces that I don't notice a friend approaching until he taps me on the shoulder, I have fallen victim to both kinds of error! We lazy, sedentary Westerners tend to do this frequently. Not so someone living hand-to-mouth in the woods.

For nearly everyone, through all the one or two million years of our evolution as brainy apes, hyper-alertness was required. Where it matters most, a Type 1 error does no harm, but a Type 2 error might be fatal. Running from a rock that looks like a leopard can make you look silly, but not running from a leopard that looks like a rock will probably get you eaten. Strangely, though we have kept our strong propensity to make Type 1 errors, as the risk of not noticing a real leopard has fallen, we are more and more likely to make Type 2 errors. In our modern world, in which we increasingly rely on forecasts and predictions, this leads to trouble.

Nate Silver, in his new book The Signal and the Noise: Why So Many Predictions Fail – But Some Don't, presents a number of similar examples that display our modern tendency to pick faces out of clouds while ignoring the approaching friend (or foe). I'll simplify matters and mention that he finds successful forecasting in only two areas: weather and baseball. Politics and stock picking and a number of other areas come in for a drubbing.

This simple diagram tells me all I need to know about "technical analysis" of stock prices. The data are the day-to-day percent change in the price of DuPont stock, from 1962 to mid September of this year. That's just over 13,000 data points. The X axis is the change on any particular day, and the Y axis is the change on the following day. This diagram shows perfect non-correlation! It is a 2-D bell curve, though with thicker tails than a Gaussian bell curve.

During those 51 years, the stock rose nearly 4,200%. That averages out to 7.7% per year but only 0.032% daily. Someone who bought $1,000 of DD stock in early January 1962 would have $43,000 today. Now, there's been a lot of inflation. That $1,000 in 1962 had the buying power of $7,740 today. So a half-century of waiting produced an effective multiplier of 5.5. That's 3% yearly after adjusting for inflation. Better than the bank.

The most extreme daily jumps are -20% and +10%. Stock speculators, particularly day traders, dream of taking advantage of the many days that a stock's price changes more than a percent or two. And such days are more common than if the distribution were strictly Gaussian. DuPont stock moves up at least 2.5% in a day about 5% of the time, and downward with similar frequency. That means, if you could pick just those up days, about 12 days each year, you could earn at least a 20% return yearly. That's 2-3 times what a buy-and-hold strategy will earn. Then, look at this:


The chart shows the historical record of DuPont stock, adjusted for splits. Focus on late 1974, late 1987, and late 2008 to early 2009. These show DD following the herd during market crashes, and represent downturns of 50%, 41% and 65%, respectively. If you could have avoided them, by selling just at the peak and buying back in at the bottom, your final return would be 9.69 times greater, for a total value of $416,000! Adjusted for inflation, that's over 8% return yearly (12.5% dollar-for-dollar yearly return).

Such figures stoke the dreams of day traders. But the first chart, showing no day-to-day correlation, dashes those dreams. Day traders work very hard for little return, and most lose. Some lose, big time, and some gain, but it is by accident either way. There are millions of day traders and other stock speculators. As Churchill wrote, "Even a fool is right once in a while."

Now we must differentiate prediction from forecasting. A prediction is a flat statement that a specific happening will or will not occur at some time or in some time horizon. For example, "There will be a magnitude 7 earthquake in Fremont within the coming year." A proper forecast includes the forecaster's uncertainty and is stated in probabilistic terms, as, "Projecting the trend of earthquakes in Fremont indicates that an earthquake of magnitude 7 or greater occurs about 3 times every 200 years." [Fremont was the imaginary State in the novel Space by James A. Michener]. One might add to such a forecast, a hybrid statement such as, "Fremont has not experienced an earthquake of magnitude greater than 6 in the past 100 years," which implies that "the big one" may be overdue. But it may indicate that conditions deep down may also be changing.

Earthquake prediction is the poster child of unpredictable phenomena. Intense study and research over decades, even centuries, have failed to yield a single valid prediction. Sports betting is close behind, except in the arena of baseball. Nate Silver once created a system he calls PECOTA, that rates the strength of teams against one another according to the past statistics of their players, and a well-known "aging curve" of the way performance changes over a player's career. Because baseball has such a rich data set, going back a century, and the principles needed to make useful forecasts are also well known, PECOTA and similar systems can evaluate players and teams at a level nearly equal to the best scouts. The computer can't quite replicate the humans, but it does give 'em a run for the money!

Why are forecasting and prediction so hard? Even though we have randomness at the deepest level of atomic phenomena, that randomness is constrained by the statistics of large numbers, and physics works very accurately to predict many systems, such as planetary orbits. Thus, though the path of an electron after passing through a hole may be uncertain, the distribution center of the paths of trillions of electrons (say, a millionth of an ampere for 0.1 second or so) will be very sharply defined and can be accurately measured, and the shape of the distribution tells you additional facts: the hole's size and shape. The much larger "distribution" consisting of the atoms making up a baseball mean that its flight, once thrown or batted, will be easily predicted.

The geological setting of an earthquake is not as simple as an electron. Perhaps this year, an earthquake might occur, large enough that the two sides of a fault will slip by each other by half a meter. That may be enough to put two kinds of rock in contact, that were not in contact before, which changes the likelihood of the next earthquake.

What about the weather? Air is in constant motion; its humidity and temperature, and thus its density, change constantly. How can anyone make a useful weather forecast? In some ways, we are still dependent on the "signs in the sky" that Jesus mentioned. In modern (18th Century) terms, "Red sky at morning, sailor take warning. Red sky at night, sailor's delight." Lore such as this is a compilation of patterns that happen over and over, so that generations of our ancestors took note and remembered. Yet now we can get a forecast up to a week or two ahead, complete with expected high and low, precipitation chances and intensity, and wind strength.

It's all done in a computer. Air may have complex behavior, but the physics of air motion and how it changes with temperature, pressure and humidity are well known. The 3D-gridded-cell models that run in supercomputers use surprisingly simple physics to determine how a 3D cell is influenced by the 6 cells it is in facial contact with, and the 8 cells at its corners. The reason supercomputers are used is that Earth is big. The surface area of the planet is 4πr², where r is 6,370 km: about 510 million km². Cells of half a km on a side, plus 0.1 km in depth (up to 12 km altitude) result in a Global Circulation Model (you'll see the acronym GCM in some weather web sites) with 1/4 trillion cells. It takes a lot of calculation to determine what will happen in the next quarter hour. There are 96 quarter hours in a day, and 672 in a week. To do all those trillions and quadrillions of calculations in only an hour or two requires today's largest computers. And the forecasters' computer gurus don't do it once, they run it several times with very small variations (the formal practice of selecting the variations is called Design of Experiments), to test the stability and sensitivity of the forecast to perturbations.

Weather forecasters have an incentive to get it right that others don't have. The reality is going to arrive tomorrow or the next day, it is visible to all, and it is no fun getting a call such as, "I have ten inches of 'partly cloudy' that I need to shovel off my driveway. Want to come over and help?" They also get a ton of research money from the Dept. of Defense, because good forecasts are crucial to military activities. Earth dynamic studies are different. Students of earthquakes can't observe the day-to-day conditions of a fault line. Its active zone is typically 8-15 km deep, and we can't yet drill a well that deep. Earthquakes are also rare. Sure, there are thousands of little ones, at the bottom of "measurable", every day, but there are trillions of weather events around the globe, every few minutes.

Mr. Silver entertains us with many, many stories of the vagaries of forecasts of all types. In the end, most phenomena are too difficult to forecast appropriately. Some involve living things. The cardinal rule of animal studies is, "Given any particular set of temperature, lighting, food availability and ambient noise, the rat will do whatever the rat wants to do." And this is in spite of lab rats being so inbred that their genetics are practically identical. The statistics of playing poker yield a few big winners, who work hard for the kind of edge they need to beat their fellow experts. But they love to be in a game that is well supplied with "fish": overconfident amateurs. A well-written computer package might tell a poker player the optimum betting strategy, but only if it is betting against other computers. The social aspects of the game, bluffing and speed or slowness of a bet for example, often provide a lot more of an edge than the math does. Carefully crafted intimidation works wonders. I don't expect a computer to master these aspects of the game for a number of decades (that's my forecast!).

The book's final example is the climate, particularly "global warming" or "climate change" or "greenhouse effect" or whatever the next buzzword will be. Climate is not weather. It is the setting in which weather happens. Climate changes unfold over multiple decades or centuries or millennia. Weather changes take seconds. In numerical analysis, this is the Stiffness problem. When something changes suddenly, it takes time for the effects to either move elsewhere or to die down. If you are interested in something with a 5-year cycle, such as El Niño (also called ENSO), the exact location and timing of today's sudden thundershower will not matter one tiny bit. If your interest is in human-induced greenhouse warming that began in the late 1700s, ENSO is an irritation at best. In fact, weather and medium-scale cycles such as ENSO are "noise" in the context of this book's thesis. Another researcher, later on, made clear a different view, that noise is really signals, but about stuff you aren't interested in at the moment.

This is like the crystal radio I made as a kid. It initially consisted of a long wire, running to a treetop, a piece of germanium crystal, and a "whisker", a wire that formed a diode with the germanium; and earphones attached to the whisker and the ground connection on the back of the germanium crystal. The diode "detected" the audio signal by separating it out of the radio frequency "hash". There was just one strong station nearby, so I could hear them pretty clearly. But later, as more stations came on the air (this was the 1950s), I could hear all of them at once. So, following a diagram in Mechanix Illustrated, I made a coil and paid a dime for a small capacitor and a piece of copper, to make a rough tuner. It could be tuned to resonate with one AM station at a time, so I could "tune out" the "noise" of the other stations. They were actually signals, just signals I didn't want right then.

The global greenhouse has warmed about 0.5°C (0.9°F) in a century, and perhaps 1°C (1.8°F) since 1750. Some of that may be warming since the Little Ice Age, which some consider a regional phenomenon, not a global one. But the current "ForecastFox for Mozilla" forecast for the next 24 hours indicates we'll have a 20°F swing tomorrow, from 75 in midafternoon to 55 overnight. You have to average out a lot of daily temperatures to see a change of a degree over 250 years. When you want weather, that is your signal. When you want climate, weather is noise, and lots of it.

The science of greenhouse warming is partly very well known, and partly not so well known. I learned to replicate the Arrhenius calculations from 150 years ago, when I was a pre-teen. Actual warming since his day has been about twice what he expected, because there seem to be amplifying factors. These are very poorly known. Does more cloud cover cool the atmosphere by reflecting more sunlight, or warm it by acting as a further thermal blanket? Or does it do one thing at a certain latitude and another elsewhere? If we do have a further warming by 2 to 4°C, will it shift the Hadley Cell north, or south, or not at all? (The northern edge of the Hadley Cell is a range of latitudes characterized by dry, descending air that form all the world's great deserts.) I've thought of buying land in central Canada, that is currently too cold to farm. Perhaps in 20 years it will be arable…unless the Hadley Cell shifts north and dries out Canada. Then maybe the Mojave would become a tropical paradise!

Y'know how to make a complex system into a positively unsolvable mess? Make it political. Both sides of the Climate debate are so politicized that they can only talk past each other. The tiniest proposal to set any policy is vigorously fought by every vested interest, even those who might benefit (the devil you know…). Heaven help us if weather forecasting ever gets politicized! It is already true that most forecasters err on the wet side: a 20% chance of rain is reported as a 40% or even 50% chance, because the ones rained on are less likely to complain, and those that aren't will feel they dodged a bullet. What if some "weather outcomes" become more politically correct than others?

By the way, I take issue with Silver's definition of statistical rain forecasts. He writes that if 40% of the computer models indicate rain in Chicago, and the rest don't, it is reported as a 40% chance of rain. Sounds logical, but it is quite different than that. The "chance of rain" has different meanings in spring (plus summer) and autumn (plus winter). Spring and summer squall lines pass through areas that are well predicted by most GCM programs. But a squall line is not a solid front of rain. It is a line of thunderstorms. A light squall line may have storms half a mile wide, spaced 2-3 miles apart, giving 20% of the area a 100% chance of rain. The forecasters just don't know which 20%, so the whole area is given a 20% chance of rain. A heavy squall line will have larger storms with closer spacing, and maxes out at about 80% coverage (though this will probably be reported as "near certain"). Fall and early winter storms tend to be solid and widespread, but subject to ripples several miles wide in the upper atmosphere. As a system rides up a ripple, it drops rain along a solid band dozens of hundreds of miles long but only about a mile wide or so. As it rides down, it dries out. The height of the ripples determines whether the overall chance of rain is 30% or 70% or somewhere between. The ripples drift along as system after system rides through, so it is very hard to tell exactly where the rain will fall. Timing is everything. Then, a lower-level storm that just dumps (ignoring the ripples) leads to those 100% forecasts, which are generally accurate.

In most arenas, Silver advocates using Bayesian analysis rather than "frequentist" simulations or estimations. These allow individualized forecasts for particular cases. An example is the probability of breast cancer in a woman in her 40s, who has just had the unwelcome news that a mammogram is "positive". The factors of a Bayesian calculation are:
  • x - Prior Estimate: the chance that a proposition is true.
  • y - Type 1 analysis: the chance that new data which indicates "Yes" is actually correct.
  • z - Type 2 analysis: the chance that the proposition is not true, in spite of the new data.
The data are usually noted as percents. The formula for a new estimate (a new x) is xy/(xy+z(1-x)). For this example, we find:


In this case, the woman may wish for a needle biopsy, but a bit of blood chemistry may be in order first. Enzymes in the blood can indicate whether a new cancer is likely to be slow growing, or faster. Is it slower (the most likely case)? She can wait a year for another mammogram. If the next mammogram is positive, re-do the analysis, replacing the 1.4% with 9.6%. Now the "new x" is just over 44%, and at the very least a biopsy is indicated. Most other forecasting methods don't use multi-step refinement. And by the way, if the next mammogram is negative (and no palpation can detect a lump, or any growth in an earlier lump), running the analysis with 9.6%, 10% and 75%, in that order, reverts to 1.4% as the "new x".

Those who follow this blog may wonder why it took me 3 weeks to read such a fascinating book. The writing is good and the examples are interesting, so that didn't slow me down. We have a lot going on, however, so I have had much less time for reading than usual. Retirement has been good to me so far, but I have to be careful not to take on too many projects at once. I completed a Real Estate course and passed the test in July. However, I will probably not seek a license or become a Realtor®, because there are simply too many other things I'd prefer to do. The change of style and reduced frequency with which I post is a similar effect. I used to post almost every lunch hour, doing research in off hours. I think I am working longer days than when I worked! Better busy than bored. Since retiring in February, I have put 24 items in my "job jar" file. Half of them, mostly the bigger ones, have been completed. One major item is awaiting an event that is at least a year in the future, but the preparations are nearly all completed. Others are smaller so I can take an odd half day to perform one. All things in their own time. In the meantime, I read when I can, and report what I read.

Wednesday, May 03, 2006

The man who would be prophet dare not miss.

kw: book reviews, nonfiction, economics, demographics, forecasting

This book took a week to read, and a couple days to think over. In The Next Great Bubble Boom: How to Profit from the Greatest Boom in History: 2005-2009, written in 2002, Harry S. Dent, Jr. forecasts a boom in the last half of the decade, followed by a significant recession, or even a depression, of about 14 years' duration. He rides on his credentials as the one who forecast the economic ride we had in the 1990s.

So is he right this time? Or is it as Churchill said, "Even a fool is right sometimes." Author Dent's main thrust is the demographic changes that America and much of the world will go through as the Baby Boom generation finishes its climb to the peak of economic power, then goes into retirement, followed by the smaller, and thus less powerful, echo boom, the X generation.

I am certain there will be a significant impact. Whether the reduction in the need for goods and services will be greater or less than the reduction of workers available is another question. In other words, we know demand is going to reduce, probably from 2010 until the early 2020s. Will the job market shrink more than the working population, leading to rampant unemployment? Will the working population instead contract the more rapidly, leading to a surplus of job and business opportunity?

The demographics are pretty clear. There are many studies of the expected population trajectory for most countries, and of the economic rise and decline of typical individuals as they age into the work force, buy houses, raise families, retire, and "fade away." The use we make of such data requires a more rigorous mathematical basis than it receives at the hands of economic forecasters.

For example, the author shows that for the average American, spending is the greatest around age 42. Then he takes the birth curve of the 1940s to 1960s, projects forward 42 years, and shows it as an economic projection. However, that curve has a rather broad peak, and is skewed: rapid rise, slower fall with aging.

To properly combine a spending curve with a changing population curve, the proper mathematical tool is convolution, AKA cross-correlation. Only a convolution of spending with age, and the numbers at each age over time, will properly predict an economic trajectory.


An extremely simplified model shows the principle. This chart shows a population bubble: an otherwise steady birthrate of 10 (thousands, millions, whatever) per time period (years, decades...), rises to 25, then drops again to 10. We'll call this the Birth Function.


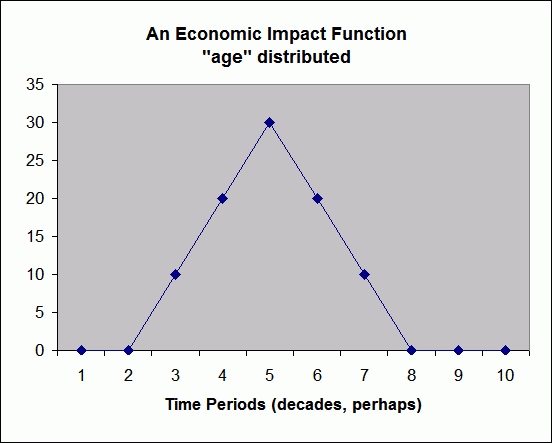
This second chart shows economic effectiveness (on whatever scale you'd prefer to measure it) as it rises then falls with age. Supposing these time periods are decades: earning "enough to care about" begins in the 20s, rises to a peak in the 50s, then falls to "too little to care about" in the 80s...on average. We can call this the Spend Function.

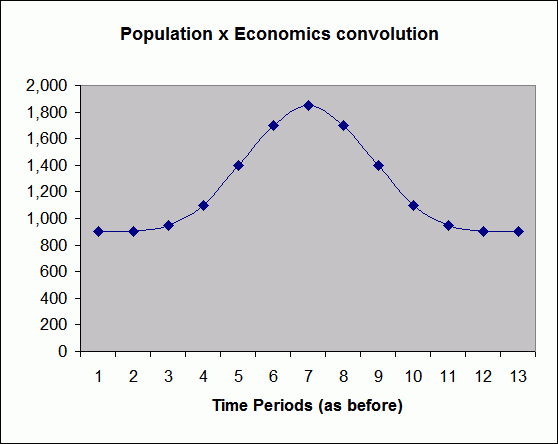
You may of course get more complicated schemes, with differing trajectories (and impact levels!) for rich, middle, and poor "classes." Regardless, the homogeneous economics-with-age Spend Function function is convolved with the Birth Function to produce our result:


This chart shows that the convolution is not as sharply peaked as the two functions that produced it. The time scale is different also; this Economic Impact Function covers about an amount of time equal to the width of the Birth Function and the width of the Spend Function.

The Birth function and Spend Function both fall from a peak to the baseline (10 in the first case, zero in the second) in three time periods. Their total width is the same, six periods.

The total width of the Economic Impact Function, the convolution, is twelve time periods. However, because it is more 'curvy', it really has a significant difference only over about eight time periods, so the fall from the peak to the effective end covers about four periods.

Now, given the many other factors that affect a national market over various periods of time, there is a lot of noise masking any signal we'd like to discern. Specifically, if the month-to-month variation in a market signal is a few percent (10% is common for the DJIA, for example, from any month to the next), it can take a long time to pick out a long-term trend.

Thus, we may expect the US economy to turn downward around the end of 2009, and it very well may. However, it may have market peaks and valleys that make it hard to determine the fall has really begun for several months. Major market slides take a couple years to work out. Only in retrospect can we say, "The downturn was such-and-such a date."

Harry Dent's book is interesting, informative, and gave me a lot to think about. I like his ideas, though I think the analyses view some noise as though it were a signal. That's where I'd put Elliott Waves, on which Dent spends a chapter. Bottom line: the Boomers and the Echo Boom can be expected to make the world economy ring like a bell for about a century to come. When you expect a downturn, how do you prepare? Best way known: start a business that caters to those you expect to have money anyway.

My grandfather, once a salesman, later a piano tuner, began renting and leasing used and repaired pianos in the 1930s. He figured almost anyone would go for having a piano if it only cost them a dollar or two a month. Everyone needs entertainment, and radios then cost a lot. He was right, and continuing piano rental receipts provided my grandparents a very comfortable retirement, including two vacation homes.

Harry Dent makes me think. I like that.