 I have been giving a little time to classifying stars' light curves on the Planet Hunters project, and by now I've classified a couple thousand stars. A recent addition to the process is the option to download a star's data, a boon to statistics-minded folk. The download is offered after one has finished classifying the star and marking any features that look like planetary transits. I hope they'll instead offer the download at the beginning.
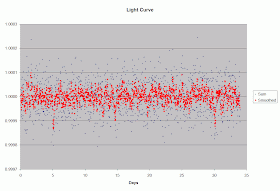
This image shows how a simple process can extract a signal from the noise in a light curve. The blue crosses are original data for a star. I added to it two simulated transits, for a planet about twice earth's size transiting the star, which was a somewhat oversize star 2.3 times the size of our sun. In the blue crosses alone it is hard to pick out the transit features at 5 and 30. The red dots show the features more clearly.
The red dots simply show the running average of five data points at a time. The original data points were taken at thirty minute intervals. I don't know how much of that interval is used to gather light, but I assume it is most of the period. The amount of scatter shown is typical of data for a star of magnitude 13. I'll discuss why in a moment. But first note that the scatter of the red dots is much less than that of the blue crosses. One danger of averaging is visible: four features that also look like transits at about 13, 15, 19, and 26. Their narrow width, and the absence of a steady time pattern gives them away as spurious: transits this brief ought to occur frequently, every 5-10 days, and very steadily. The longer an orbit, the slower the planet, and the longer a transit will take.
Why is there this scatter in the data? Primarily because of photon counting statistics. The bulk of the blue crosses are found in the range 0.9999-1.0001, a band only 0.02% wide. This indicates that around 100 million photons were collected per observation of this star. The standard deviation of a counted sample is very close to the square root of the number of counts: the square root of 100,000,000 is 10,000; divide the two to get 0.0001. Many of the stars in the project are magnitude 15, or 6.3 times dimmer than this star. The square root of 16,000,000 is 4,000; divide to get 0.00025. Starting with more than twice the noise makes it more than twice as hard to "see" a transit feature of a specific size.
The averaging simulates counting 5x as many photons, and thus reduces the noise by a factor of 2.2. Even a very close-in planet will have a transit lasting at least a couple of hours, or four 30-minute data intervals, so the averaging helps over most of the range of possible planetary orbits.
So far, I've identified lots of things I thought were transits. One of these has recently been declared a verified transit. I saw that about ten other planet hunters also identified it. Just a tiny thrill, but something to keep a lot of folks checking star after star. Our work helps focus the energies of the people running the project.
No comments:
Post a Comment